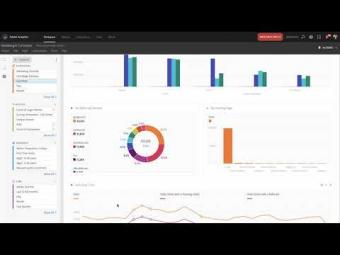
Treemap and Scatterplot Visualizations in Analysis Workspace
As of 21 January 2016, Analysis Workspace in Adobe Analytics now includes two popular visualization types: treemap and scatterplot. This video explains how to use both visualization types in your analysis. To view the video bullet graphs, go to https://www.youtube.com/watch?v=MYl_uDDyL70.
For more information on this feature, go to:
https://marketing.adobe.com/resources/help/en_US/analytics/analysis-workspace/treemap.html
https://marketing.adobe.com/resources/help/en_US/analytics/analysis-workspace/scatterplot.html
For more information on this feature, go to:
https://marketing.adobe.com/resources/help/en_US/analytics/analysis-workspace/treemap.html
https://marketing.adobe.com/resources/help/en_US/analytics/analysis-workspace/scatterplot.html
ÖNERİLEN YAZILAR


YORUMLAR