100% Stacked Visualizations in Analysis Workspace
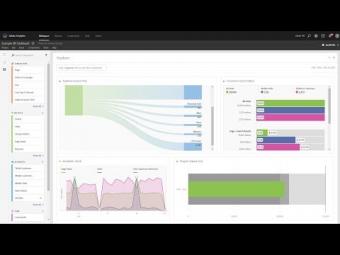
Stacked graphs are helpful for representing parts to a whole in a trend. The new 100% stacked viz setting further helps to quickly see how each part contributes to the whole, in terms of a % value instead of a raw value. This new setting is available from the Visualization Settings gear in the top right of Area Stacked, Bar Stacked and Horizontal Bar Stacked vizs.
ÖNERİLEN YAZILAR


YORUMLAR